Production Metrics
Aphrodite supports visualizing the inference metrics for production use. Please see the example attached below.
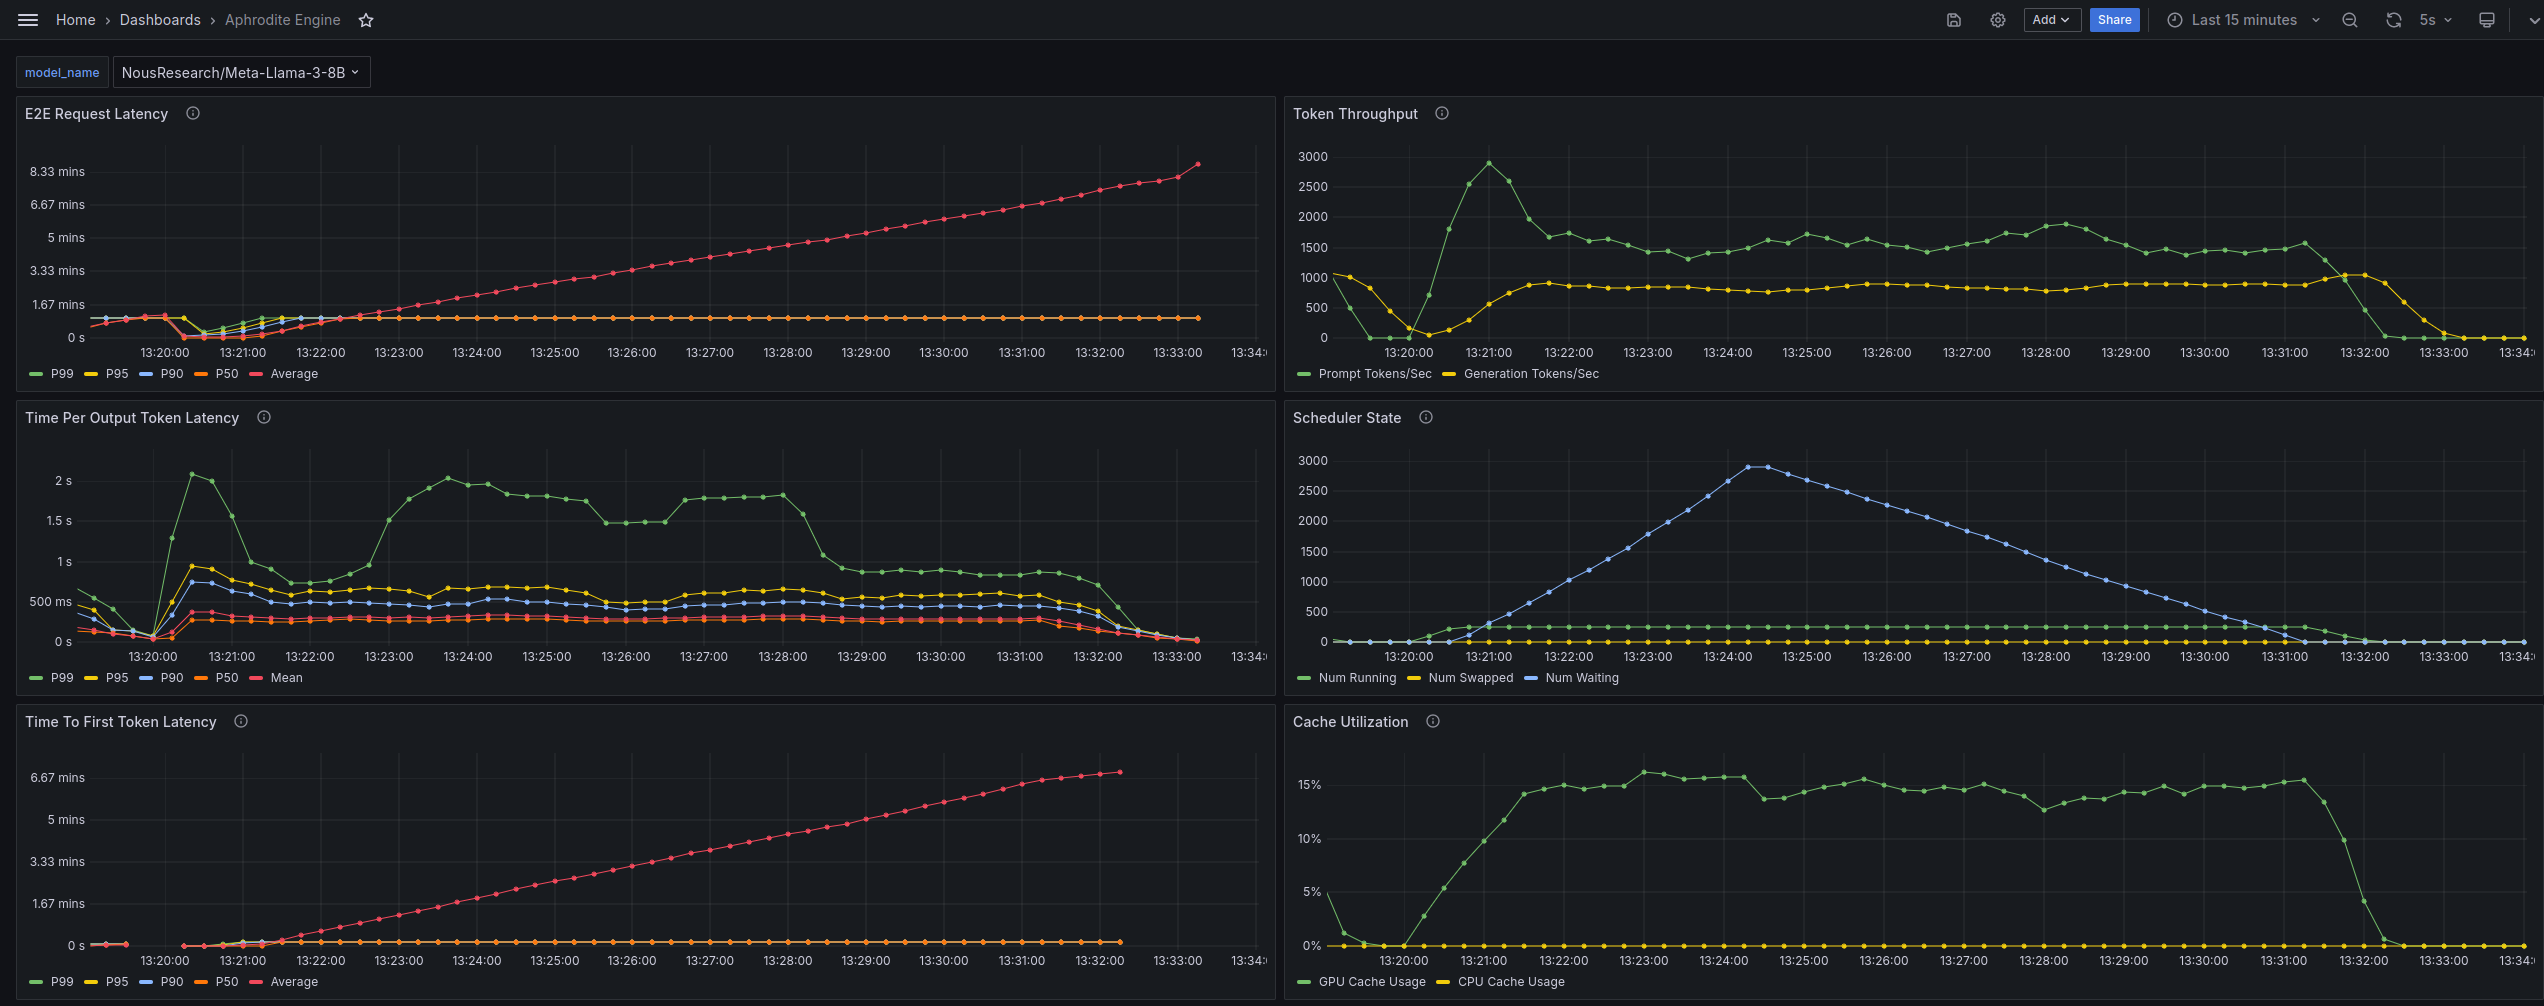
We use Prometheus for scraping the metrics and Grafana for the visualization.
Make sure you have an Aphrodite endpoint set up, then run this in the cloned Aphrodite repository:
cd examples/monitoring
docker compose up
TIP
If you don't have docker installed, install docker and docker compose
You can now begin sending requests to the API server. Navigate to http://localhost:2242/metrics for the raw output. Next, you will set up Prometheus with Grafana.
Navigate to http://localhost:9090 to view the Prometheus UI. Click on the Status menu and select Target. You should see an OK response to the metrics endpoint. If you don't see an OK response, refer to this section.
Next, navigate to http://localhost:3000 to see the Grafana UI. It may ask for login credentials, it'll be admin for username, and admin for password for the first login.
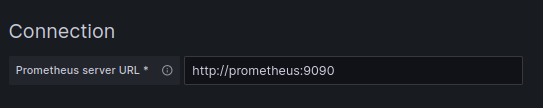
Next, you'll want to do two things: set up a Data Source (Prometheus), and configure your dashboard. Head over to http://localhost:3000/connections/datasources/new and select Prometheus. Insert http://prometheus:9090 for the URL.
Scroll all the way down and click on Save & Test. It should return with a confirmation that it works OK. Now, head over to http://localhost:3000/dashboard/import. Type 20397 in the ID field to import the Aphrodite template and click on Load. In the next page, select your Prometheus data source from the drop down menu and finally click on Import. That should be all!
Prometheus Endpoint Not Working
In some cases, you may not see an OK response in the Prometheus Target menu. This is usually due to Docker container port forwarding issues. We're trying to have the container scrape from the host, which is an unusual use-case. An easy solution is to use cloudflared tunnels to forward your local port to a public URL.
First, shut down all running containers by running docker compose down in the examples/monitoring directory.
Download the binary from here and run the following:
chmod +x cloudflared-linux-amd64

./cloudflared-linux-amd64 tunnel --url localhost:2242
Then edit prometheus.yaml and make the following changes:
global:
  scrape_interval: 1s
  evaluation_interval: 1s

scrape_configs:
  - job_name: aphrodite-engine
    metrics_path: /metrics
    scheme: https
    static_configs:
      - targets:
          - 'host.docker.internal:2242'
          - 'your-cloudflare-url.trycloudflare.com'
Replace the URL with your cloudflared URL, then launch the container again with docker compose up.